A matrix can be accessed from the Variable Browser.
For a very small matrix, the contents are visible in the Variable Browser. However, for a larger matrix, the size is displayed there
instead. All matrix content can be viewed and edited by double-clicking on its name in the
Variable Browser. This displays the contents in a separate grid
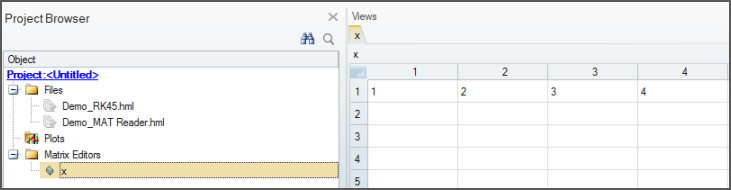
view. Each matrix is displayed in its own grid and each grid is listed in the Project Browser, named after the variable itself. The grid views can be
deleted or hidden by accessing the context menu on the grid name in the Project Browser. Figure 1. Grid view in the Variable Browser
Each filled cell in the grid is editable by double-clicking on the cell. Only single
numeric values (including complex) can be entered. The matrix is updated immediately. The
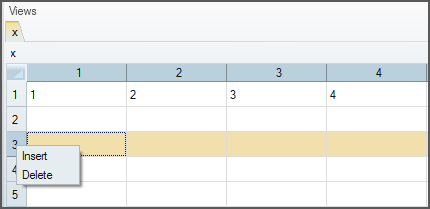
matrix can be expanded in each dimension individually by selecting rows or columns and
accessing the Insert option from the context menu (new cells are filled
with zeros). Similarly, rows and columns can be deleted as well. Figure 2. Insert/delete options