Plots (either 2D or 3D plots) are created by executing plot commands from either the
OMLCommand Window or inside an OML script.
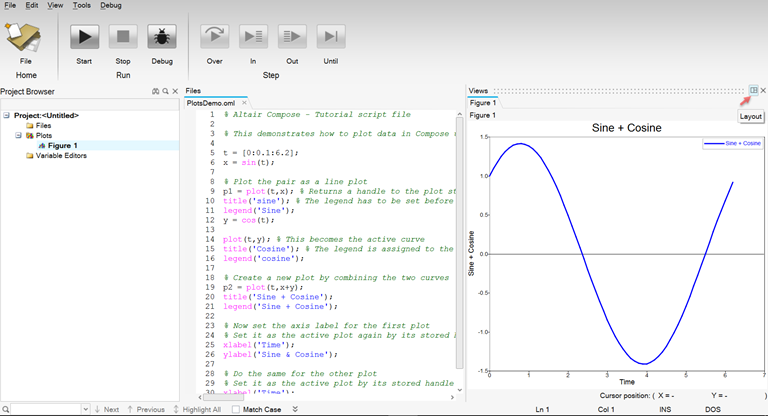
Plots are displayed in a dedicated area located to the right of the Editor area.
The IDE offers layout management options to show either one or multiple plots. Figure 1.
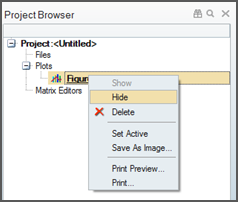
Plots created by OML commands are listed in the Project Browser. Selecting a plot in the Project Browser provides access to:
Editing the plot properties in the Property Editor