Compose-1100: Working with the Compose Debugger
Tutorial Compose-1000 introduced basic operations to create, edit, and run a simple OML script in Compose. Compose-1100 introduces the debugger.
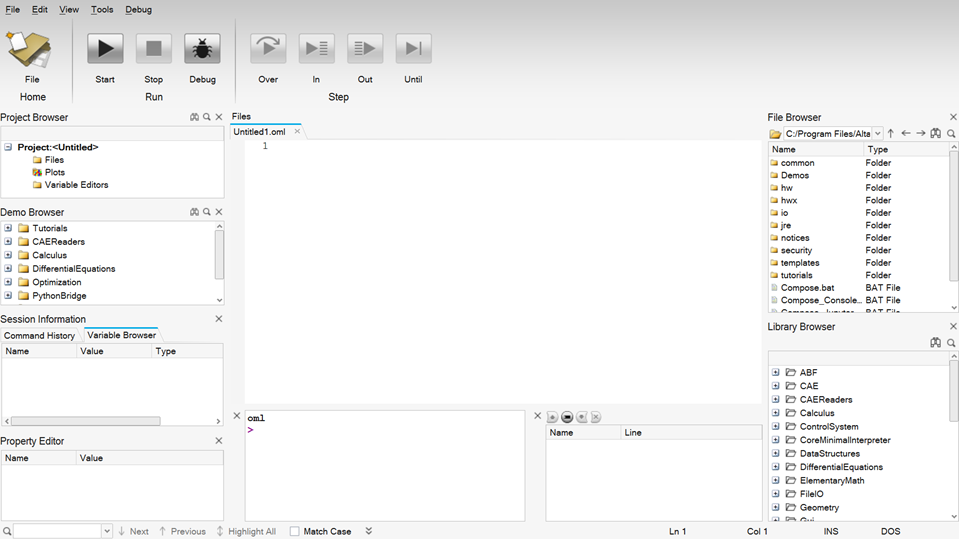
Launch Compose
This launches Compose. Notice that by default, a file named Untitled1.oml exists in the Editor window.
By default, the application is in Authoring Mode, where scripts can be edited and executed interactively.
Start the Debugging Mode
-
Click the Debug icon,
 , or select the menu item .
This turns ON the debug mode. Additional items become active in the toolbar (Step) and additional windows are available. These include the Watch window, Call Stack window, and the Breakpoints window. They can be displayed on demand from the menu.
Add a Breakpoint and Start Debugging the File.
-
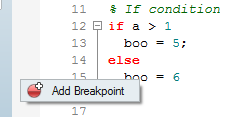
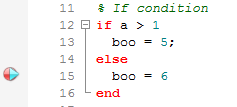
A breakpoint is added to the debugging session by left-clicking in the margin
to the left of the line numbers. Add a breakpoint at line 15.
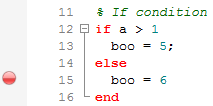
A breakpoint is indicated by a red circle in the margin.
-
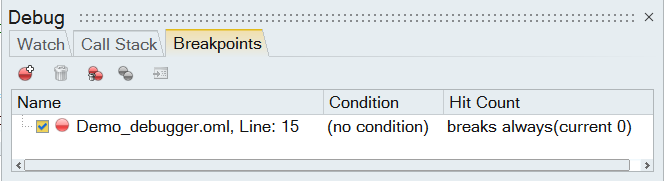
Click the Breakpoints tab, located next to the Call
Stack tab at the bottom of the GUI. Or, from the Debug menu, select .
A breakpoint is now listed and located at line 15.
-
Begin debugging the file by clicking Run File,
 , from the Debug toolbar.
Due to the breakpoint at line 15, the execution of the file stops at line 15. In addition to the red circle indicating the breakpoint at line 15, there is also a blue triangle at this line. The blue triangle indicates that this is the next line to be executed.
Inspect Variable Values Using the Editor and Watch Windows
-
Variables can also be inspected using the Watch window.
The Watch window is located in the lower left corner of
the Compose GUI. In the Editor window, using the left mouse button, highlight the
variable boo, then drag the variable from the Editor window into the Watch window.
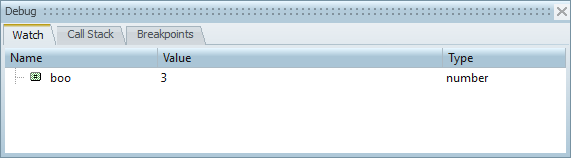
You can also highlight boo, then right-click to choose Add Selection to Watch.
The value of boo is currently 3.
-
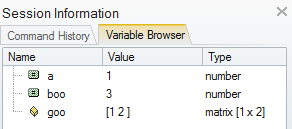
During debugging, the Variable Browser always displays
the variable’s value in the current scope.
-
Click the Step Over icon,
 . The value of boo has
changed. This can be verified by the value of boo in the
Variable Browser or by inspecting the value in the
Watch window.
. The value of boo has
changed. This can be verified by the value of boo in the
Variable Browser or by inspecting the value in the
Watch window.
-
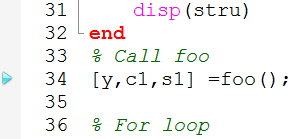
The blue arrow indicating the next line to be executed is now at line 34. Use
Step Over, , to move the execution to the next
line.
Enter a Function and Investigate the Call Stack Window
-
To enter the function
foo, click the Step Into icon, .
.
Selecting Step Over executes the function
foo. If you want to individually execute each line inside the functionfoo, select Step Into instead.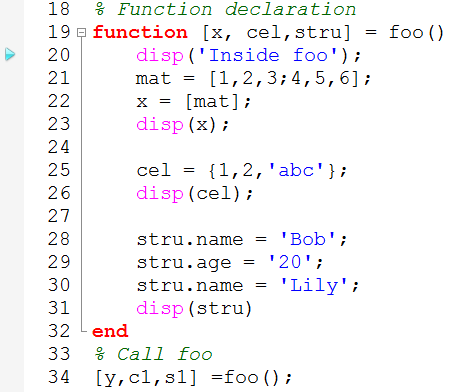
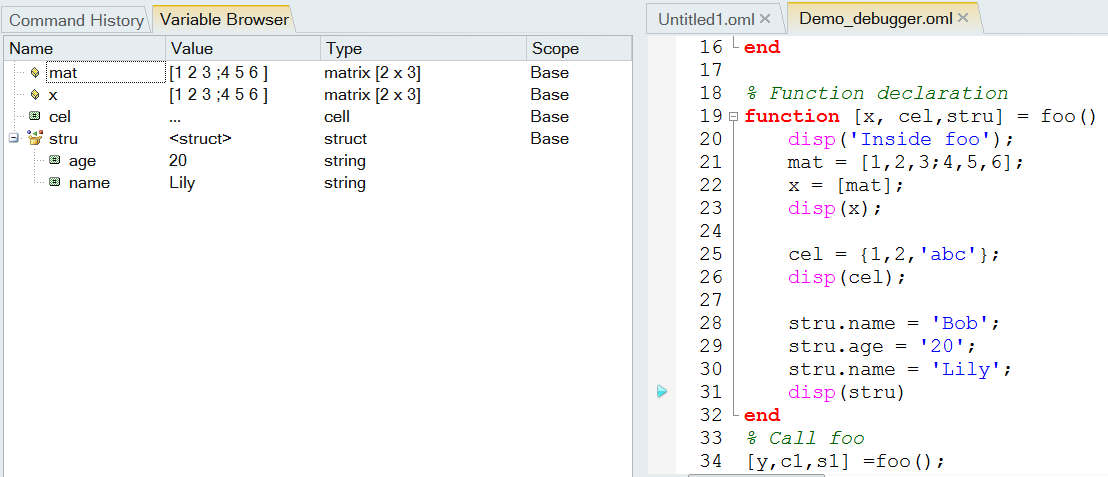
Once Step Into has been selected, the blue triangle moves to line 20.
-
Click the Call Stack window tab.
Investigate the contents inside the Call Stack window.
The current execution point (line 20) is listed as well as the calling point to
the function
foo(line 34).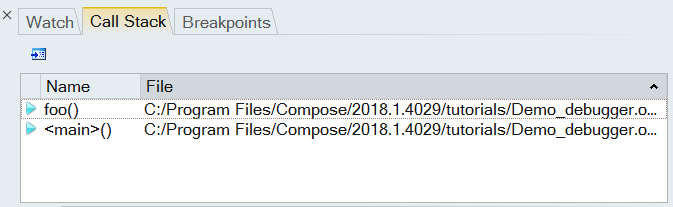
Investigate Variables in a Function Using the Variable Browser and Watch Window.
-
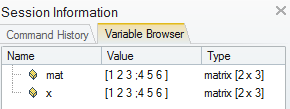
Click Step Over, , to execute each line, one at a time,
until line 23 is reached.
-
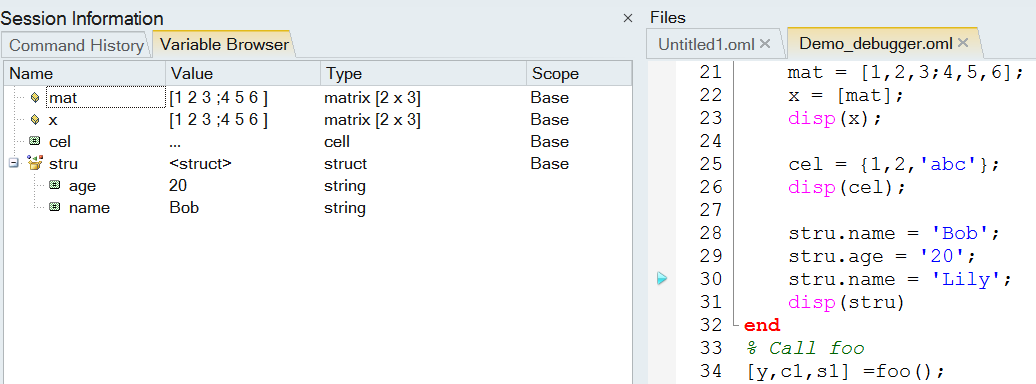
Under the Value column in the Variable Browser, notice
the values for mat and x:
-
Click Step Over, , a few more times until line 26 is
reached.
-
Under the Name column in the Watch window, type the
variable name cel.
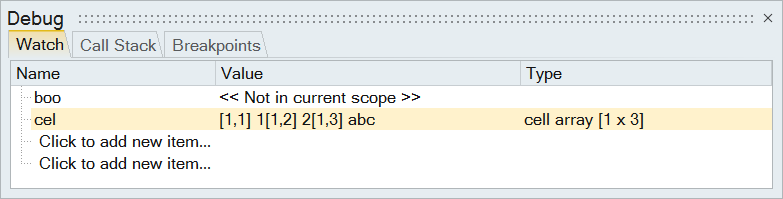
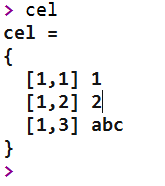
The contents of the variable cel are updated in the Watch window. The Type column indicates that the variable cel is a cell and there are three elements in the cell. The values are listed in the Value column. You can also type cel in the OML Command Window to check the elements’ values:
-
Click Step Over again, , until line 29 is reached.
-
After running line 29, you can view the stru fields by clicking the
'+' in front of this struct in Variable Browser. The struct is now expanded and you can see
its content.
-
Check the name field again after clicking :
-
From the Debugging toolbar, click the Step Out icon,
 , to execute the rest of the function and
exit it in a single step. The marker moves to the next execution point in the
path, which is at line 37.
, to execute the rest of the function and
exit it in a single step. The marker moves to the next execution point in the
path, which is at line 37.
Use the Step Until Option on the Debug Toolbar
-
From the Debug Step toolbar, click Step Until,
 .
.
This executes the rest of the lines and stops at the line with the cursor. This is convenient if you do not want to add a breakpoint at a line, as a breakpoint would stop the execution of the code at this line every time. Using Step Until only stops the execution at this line this one time.
-
Right-click in the Watch window
and select Remove All. Select Yes
to the message that prompts if you want to delete all entries.
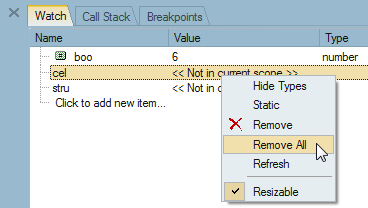
This clears the Watch window to allow for a clean look at the variables to be inspected.
-
Click Step Over, , once inside the
for
                        loop
to observe its value change incrementally in the Watch window.
Add a Condition to the Breakpoint
-
Type
a == 5and click OK.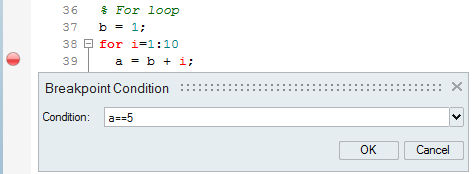
-
Click the Run File icon,
 , to continue until the execution stops at
the breakpoint, which is only when the above condition is met as seen from the
Watch window.
, to continue until the execution stops at
the breakpoint, which is only when the above condition is met as seen from the
Watch window.
Add Another Breakpoint, Enter the Function zoo, and Observe the Call Stack Window.
-
Click Run File, , to execute the rest of the code and stop
at line 53, where the breakpoint is located.
-
Line 53 calls the function zoo and passes the argument
10. Click Step Into, , to enter the function
zoo and move the execution point to the first line in the
function.
-
Click Step Over, , twice to move to line 50 (line 50 calls
the function foo).
-
Click Step Into, , to enter the function
foo and move the execution point to the first line in the
function. This moves the marker for the next execution point to line 20. Observe
the Call Stack window. This displays the execution path
through all functions to the current marker location. At the top, it shows the
inner most function the execution is currently in (function
foo), followed by the next outer function,
zoo, which is followed by the main function
level.
Also note the blue marker in the editor margins at locations where each of these functions were called. These lines are also displayed in the Call Stack window’s second column. This allows you to find which instance of a function call lead to the current location, if there are multiple instances.
Stop Debugging and Exit the Debugging Mode
-
From the debugging toolbar, click Stop Debugging,
 , to stop the current execution.
-
Press the debug icon, , to exit the Debugging Mode.
- This returns the Compose GUI to the Authoring Mode. At this point, you can continue with any authoring mode activities.