Compose-4040: Using Compose Math Functions for Digital Filtering
Compose OML language provides functions for digital filtering
This tutorial demonstrates how to use the butter, butterord, filter, and filtfilt commands.
Create a Test Signal for Digital Filtering
-
From the File menu, select Open and locate the file
<installation_dir>/tutorials/ /DigitalFilter.oml.
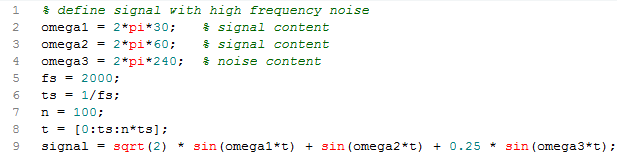
The file contains code to create sampled data from a signal with two content frequencies, and one higher noise frequency.
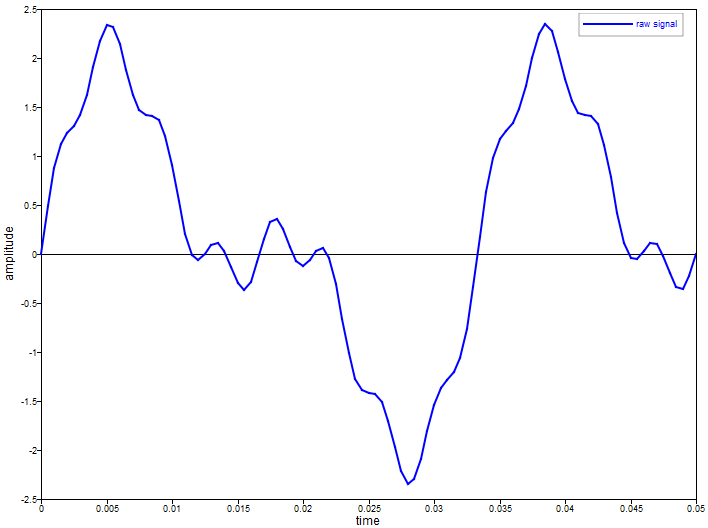
The plot looks like this.
Design a Butterworth Filter to Remove the Noise
A Butterworth filter is defined with a cutoff frequency at its half power point, which is an attenuation of approximately 3dB.
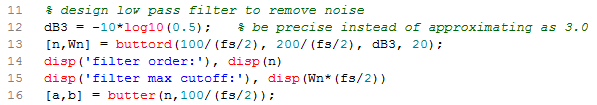
To separate the signal from the noise, we specify a cutoff frequency at 100Hz, with an attenuation of at least 20dB at 200 Hz, thus indicating a low pass design. The buttord function computes the lowest filter order that will attain the required performance. Since filter orders are integers, rounding typically results in a range of cutoff frequencies that will meet or exceed the requirements.
The buttord function also computes a second cutoff frequency, so that the input and output cutoff frequencies span the range of acceptable choices.
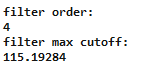
For this tutorial, select the low end of the range, which is the 100 Hz input. The code to design the filter and its output is shown below. The input and output frequencies are normalized relative to the Nyquist frequency (half of the sampling frequency).
Filter the Signal and Plot the Result
The [a,b] outputs of butter are the numerator and denominator polynomials of the filter. The filter and plot code are as follows, along with the plot itself.
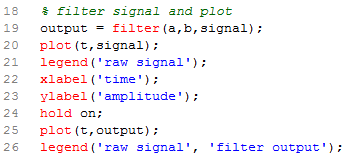
The hold command allows a second curve to be placed on the same plot.
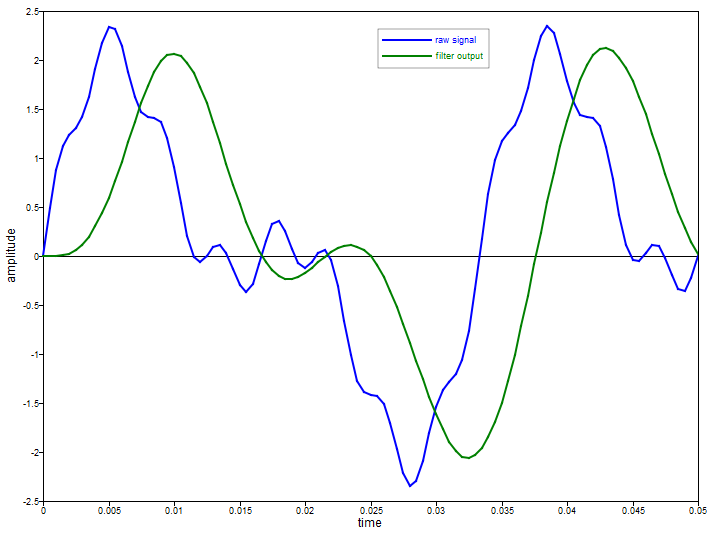
The noise has been removed from the signal, but there is a time lag between the signal and its filtered output. The time lag is actually slightly different for each frequency component of the signal, which creates phase distortion. For many applications, this is completely acceptable. When it is not, the filtfilt function can be used.
Design a Butterworth Filter to Use with filtfilt
The filtfilt function is so named because it filters the signal twice, forward and then in reverse. The second pass causes the time lags from the first pass to be reversed. The drawback to filtfilt is that it cannot be implemented in real time.
If the filter from Step 2 were used with filtfilt, the attenuation would be doubled due to the two passes through the filter. Therefore, the design procedure needs to be modified by cutting the input attenuations in half. The code to design this filter and its output is shown below.
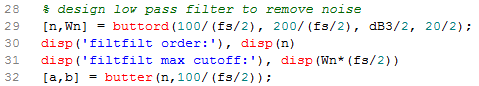
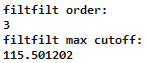
With two passes, a lower filter order is expected.
Filter the Signal with filtfilt and Plot the Result
The filter and plot code are as follows, along with the plot itself.
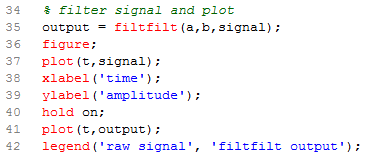
The figure command creates a second plot.
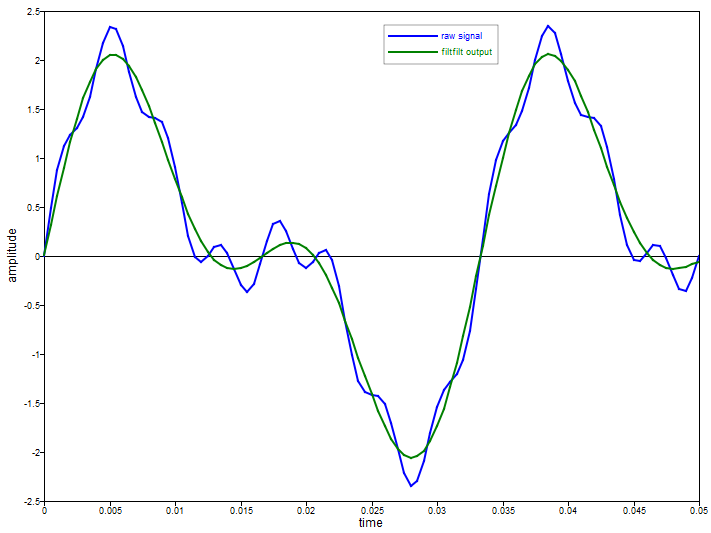
Note that the filtfilt output is very similar to the filter output, but the time lag has been removed as expected.