Next, plot blocks are prepared to display simulation output.
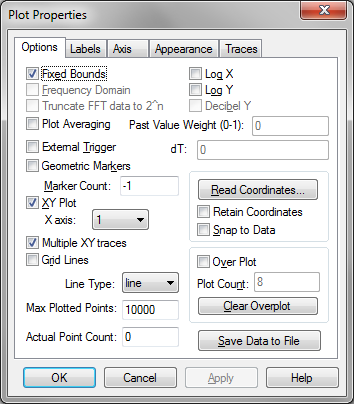
Place a plot block (located under Blocks > Signal Consumer) in the diagram; then open its dialog box and under the Options tab enter the following settings:

Note that the Multiple XY Traces option is activated. This feature allows the display of the target motion independently from the servo line of sight.
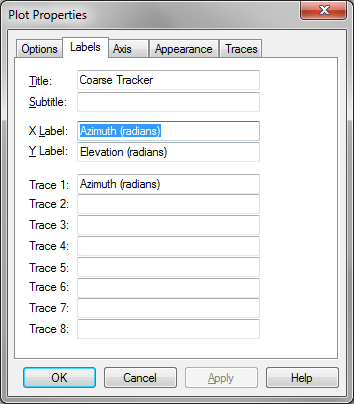
Under the Labels tab, enter the information shown below.

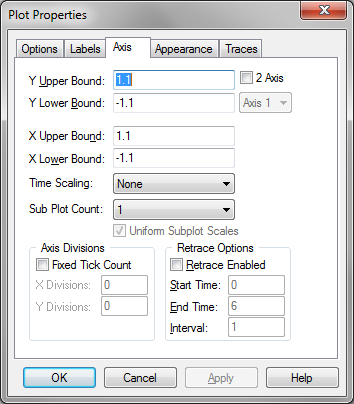
And under the Axis tab, enter the following information:

Place another plot block in the diagram and enter the same parameters as in the previous plot with these exceptions:
Under the Labels tab, make these changes:
•In the Title box, enter Focal Plane
•Enter degrees as units instead of radians
•Under the Options tab, make these changes:
•Activate Fixed Bounds
•De-activate Multiple XY Traces
•Under the Axis tab, make these changes:
•In X Upper Bound and Y Upper Bound, enter 5
•In X Lower Bound and Y Lower Bound, enter –5