Checking and Editing Mesh
Once a mesh is created, HyperMesh has many tools for checking element quality and modifying the mesh to make it more desirable. These tools can be used at almost any point in the meshing process. This section is separated from sections on creating mesh so that the focus can be on checking and editing tools.
In this section, you will learn how to:
- Identify shell element connectivity problems.
- Correct shell element connectivity problems.
- Review the model’s shell elements to ensure connectivity problems were corrected
- Re-mesh the elements along the rib.
Checking and Editing the Mesh: Tools
These mesh editing tools can be found on the 1D, 2D and 3D pages and can also be reached through the Mesh > Edit > Elements pull-down.
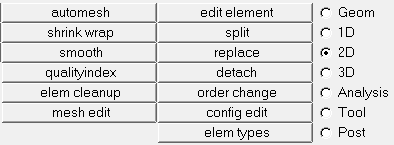
- Edit element
- Combine – merge 2 or more elements into 1 single element
- Split – draw a line to cut elements
- Cleanup – interactively drag nodes to improve element quality
- Split– divide selected elements in a selected manner
- Replace– merge 2 nodes into 1 node (elements are now connected)
- Detach– disconnect selected elements from other elements
- Smooth– improves quality of selected elements
- Quality index
- Set criteria for all standard quality checks
- Simultaneously evaluate element quality
- Combine all checks into a single value called “compound quality index value”
- Edit nodes and elements interactively or by automatically maximizing element quality
These tools can be found on the Tool page.
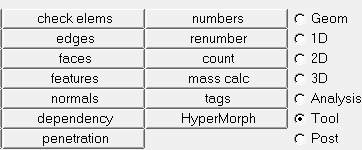
- Check Elems – evaluate elements against various element quality criteria
- Jacobian, warpage, angle, min. length, aspect ratio, skew
- Edges
- Display free edges in the model by creating 1D elements on each one
- Equivalence (merge) nodes within a specified tolerance
- Normals – display and correct element normals
- Penetration – display and correct element penetration
Selected tools from the list above are described in more detail below. Open the sections for more infomration on the tools.
The Check Elements panel allows you to verify the basic quality of your elements and the geometric qualities of those elements. Mouse over each check for a definition of each.
Use the Quality Index panel to calculate a single value to represent the quality of the displayed shell (2-D) model. Criteria settings are stored and retrieved using a criteria file. You can save the results from the Quality Index (QI) panel to a summary file. When you open the Quality Index panel, HyperMesh changes the color of the elements according to how well they adhere to the pre-set quality requirements, rather than according to their component or any other visualization mode chosen.

On the right-hand side of the panel, you can review the compound Quality Index, as well as the number of elements and the percentage of elements that failed a quality check. To highlight elements falling at or below a certain quality level, move the display thresholds slider. Lastly, you can access the cleanup tools and save a list of failed elements. The left-hand portion of the Quality Index panel consists of four pages; the current page number displays in the upper-left corner of the panel. To either side of the page number, a small arrow button allows you to page forward or backward to view the other pages. In addition, one column on pages 1 and 2 includes a toggle at the column heading; use this toggle to switch the column between displaying the worst quality value found for each quality check, or the total Q.I. value generated by each check.
Element Quality View is a permanent visualization mode that HyperMesh displays in the upper left-hand corner of the graphics area when you select By Element Quality on the Visualization toolbar. Use this tool to investigate each specific element criteria, view a breakdown of all failed and worst elements, resolve all criteria violations at one time, and evaluate the over all quality of a mesh.
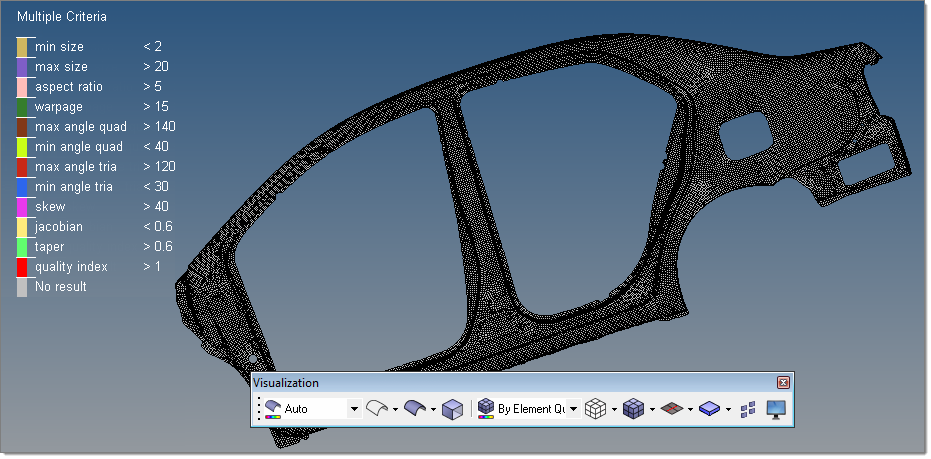
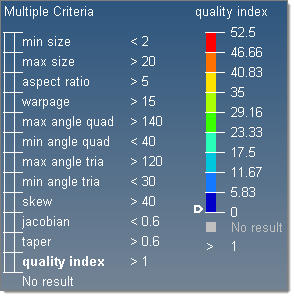
Multiple Criteria Legend
When you select Element Quality View, HyperMesh displays the Multiple Criteria legend by default.
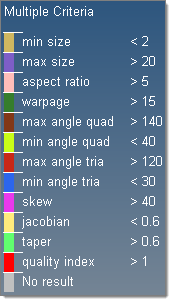
In this legend, you can:
- Review the different 2D element criteria.
- Adjust the initial threshold values assigned to each 2D element criteria.
- Select specific criteria to investigate further.
The Element Quality View tool bases the initial threshold values on the ideal, good, warn, fail (default), and worst values that are defined in the current 2D element criteria settings. By default, this tool bases the initial threshold values on the fail column. You can directly edit these values from the Element Quality View or you can edit them in the Criteria File Editor.
Single Criteria Legend
Each 2D element criteria, in the Multiple Criteria legend, has its own single criteria legend. The single criteria legends consists of a color coded sliding scale, which you can use to evaluate the elements in the graphics area and resolve all criteria violations.
The colors exhibited in the sliding scale reflect the quality of each element in the graphics area. The elements that are of the best quality will always display in blue, whereas, the elements that are of the worst quality will always display in red. The Element Quality View tool determines the quality of each element using the 2D element criteria that you defined in the Multiple Criteria legend.
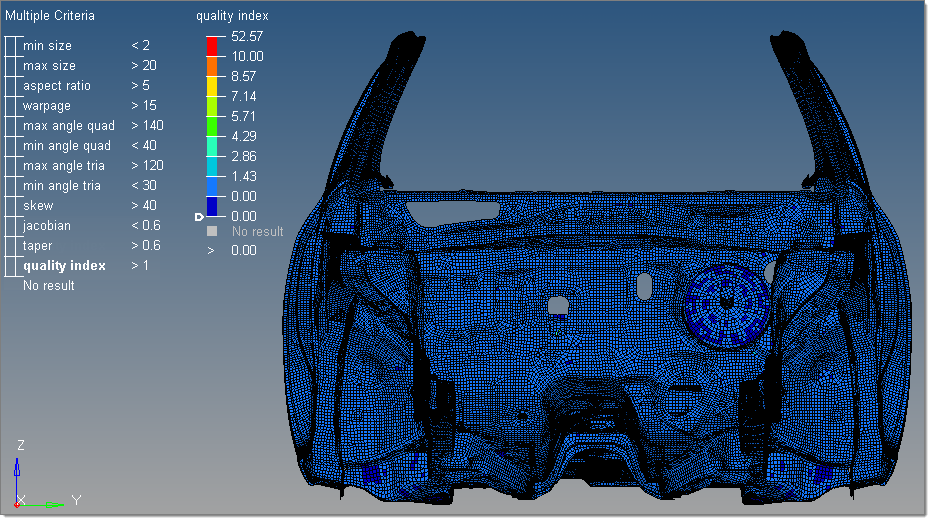
The Element Quality View tool always lists the values in the sliding scale from low to high, with the lowest value always being at the bottom of the scale and the highest value always being at the top. This tool always defines the first and last values in the legend with the minimum and maximum values. You cannot edit the minimum and maximum values.
The second and second to last values are the initial legend range coverage, based on the good to worst, warn to worst (default), fail to worst, and min to max values. These values are taken from the criteria file, and can be edited. The Element Quality View tool interpolates the values in between these.
Each single criteria legend contains a slider that is located, by default, at the exact, current threshold position. If the initial legend range coverage does not provide the threshold value set defined in the settings, then the slider will be positioned to the closest available value. To view a breakdown of all of the failed and worse elements, move the slider up and down.
The Patch Checker toolbar contains a group of icon buttons that you can use to review quality results, sliver surfaces, elements attached to selected nodes, and so on. Click the various icon buttons to review "patches" of elements, nodes, and surfaces. Entities placed on the user mark are used as input. The user mark is populated by using the save option from advanced entity selections, specific panels that have the save button (such as Check Elems), or via Tcl script using *marktousermark. This tool creates "patches", or local regions, from each input entity. A patch includes only displayed entities. Patches are not created for any input entities that are not displayed. A spherical clipping is then calculated and applied for each patch, with the input entity highlighted and the adjacent entities low lighted. In order to keep the performance high, only the first 500 entities on the user mark are considered.
