h = patch('vertices', vertices_matrix, 'faces', faces_matrix)
h = patch(hAxes, ...)
Inputs
x, y, z
Coordinates of patch vertices.
Type: double | integer
Dimension: vector | matrix
c
Patch color.
Type: char
Dimension: scalar
vertices_matrix
An Mx2 or Mx3 matrix that contains the coordinates of the patch vertices. M is the number of vertices.
Type: double | integer
Dimension: matrix
faces_matrix
An MxN matrix that contains the indices of the vertices of each patch. M is the number
of patches and N is the number of vertices of each patch. NaN may be
used if not all polygons have the same number of vertices (see the Examples
section).
Type: double | integer
Dimension: matrix
hAxes
Axis handle.
Type: double
Dimension: scalar
Outputs
h
Handle of the patch graphics object.
Examples
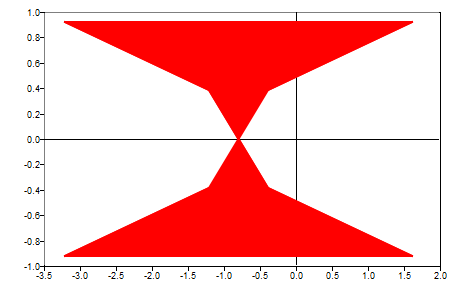
2D patch plot
example:
clf;
t1 = (1/16:1/8:1) * 2*pi;
t2 = ((1/16:1/8:1) + 1/32) * 2*pi;
x = tan (t1) - 0.8;
y = sin (t1);
h = patch (x',y','r')
Figure 1. 2D patch plot example
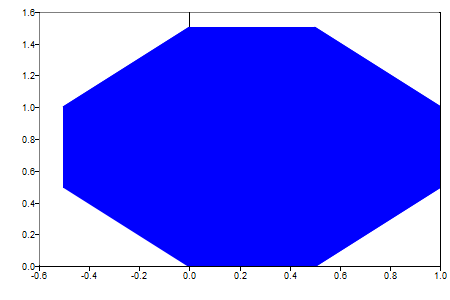
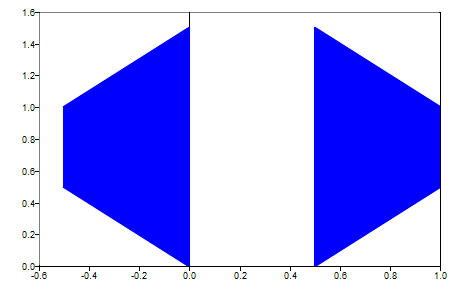
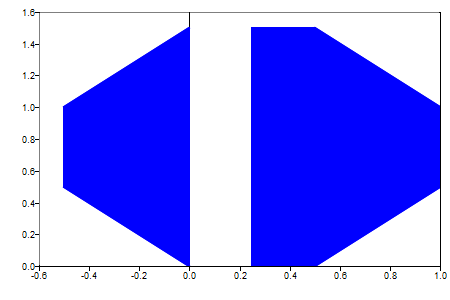
2D patch plot defined by vertices and faces matrices
examples:
x = [0 0.25 0.5 1 1 0.5 0.25 0 -0.5 -0.5]';
y = [0 0 0 0.5 1 1.5 1.5 1.5 1 0.5]';
verts = [x, y];
figure(1);
% Create one patch which constinst of 10 vertices
faces = [1:10];
h = patch('vertices',verts,'faces',faces);
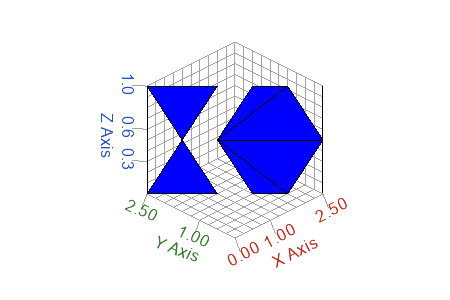
figure(2);
% Create two patches each one consisting of 4 vertices
faces = [3 4 5 6; 8 9 10 1];
h = patch('vertices',verts,'faces',faces);
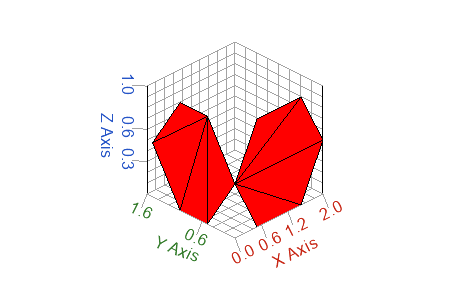
figure(3)
% Create two patches, the first patch consists of 6 vertices,
% the second patch consists of 4 vertices
faces = [2 3 4 5 6 7; 8 9 10 1 NaN NaN];
h = patch('vertices',verts,'faces',faces);
Figure 2. 2D patch plot defined by vertices and faces matrices
Figure 3. Create two-2D patches defined by vertices and faces matrices
Figure 4. Create two-2D patches that have different number of vertices
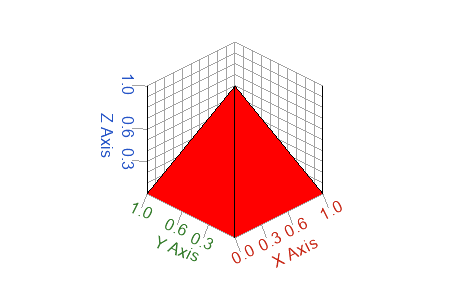
Example of 3D patch plot. Patch faces are triangles: