gensig
Generates an input signal for the lsim function.
Syntax
[U, T] = gensig(TYPESIG, Tau)
[U, T] = gensig(TYPESIG, Tau, Tf)
[U, T] = gensig(TYPESIG, Tau, Tf, Ts)
Inputs
- TYPESIG
-
- string "sin"
- Sine wave.
- "cos"
- Cosine wave.
- "square"
- Square wave.
- "pulse"
- Periodic pulse.
- Tau
- The duration of one period in seconds.
- Tf
- The duration of the signal. Default = five periods.
- Ts
- The sampling time in seconds. Default = Tau / 64.
Outputs
- U
- The signal vector.
- T
- The time vector.
Examples
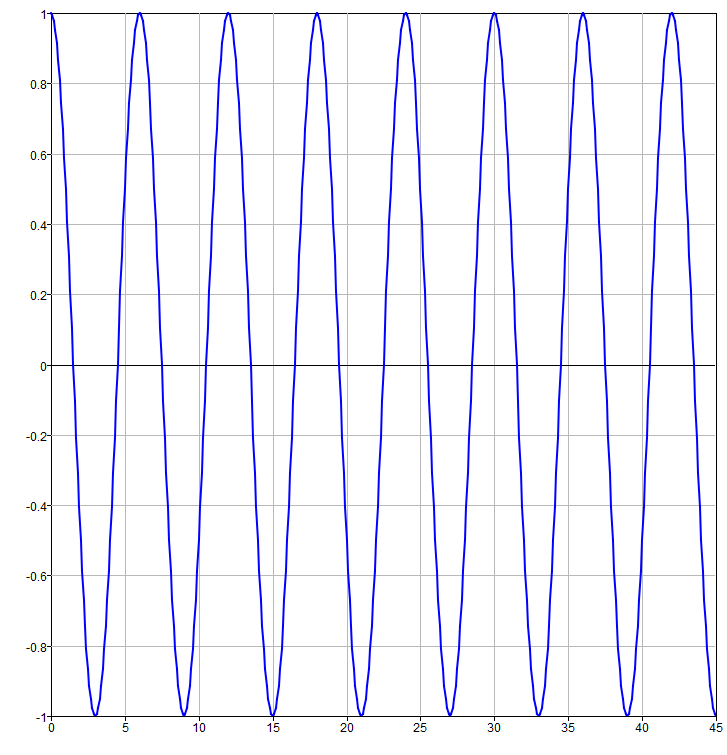
Generation of sine wave using the gensig function:

[u, t] = gensig('sin', 6, 45, 0.1);
sys_cl=ss((tf([1],[1 3 2])));
lsim(sys_cl,u,t);
Generation of cos wave using gensig funtion:
[u, t] = gensig('cos', 6, 45, 0.1);
h2 = plot(t, u);
grid;
Generation of square wave using gensig function:
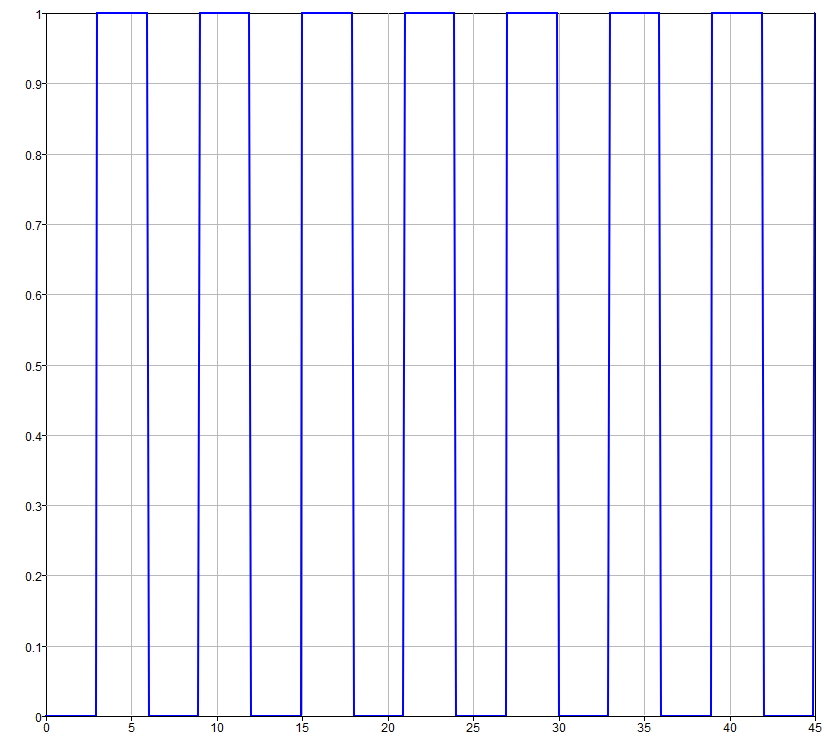
[u, t] = gensig('square', 6, 45, 0.1);
h3 = plot(t, u);
grid;
Generation of pulse train using gensig function:
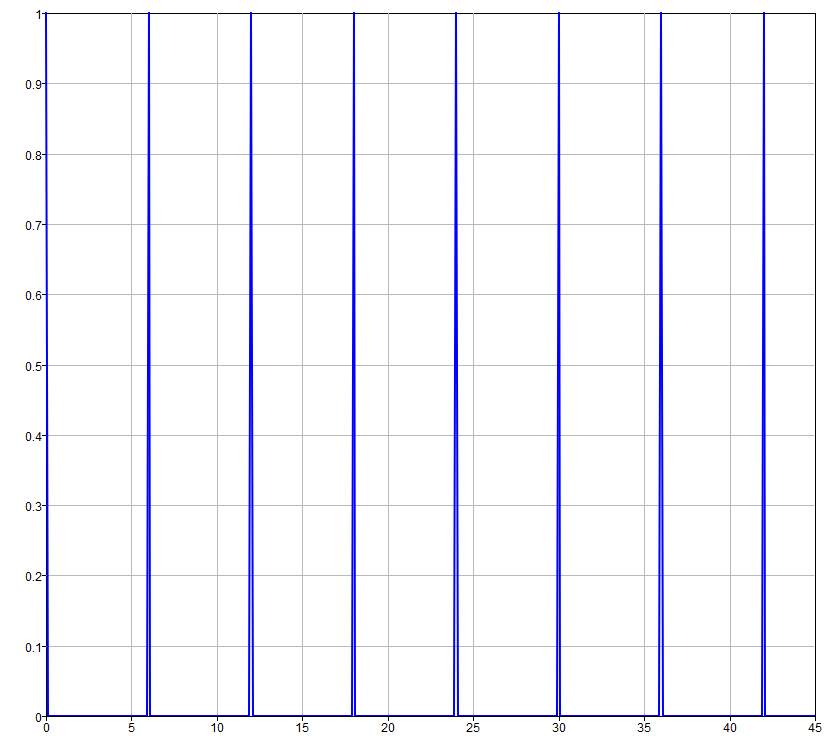
[u, t] = gensig('pulse', 6, 45, 0.1);
h4 = plot(t, u);
grid;
Comments
Generating a periodic signal, this function can be used in conjunction with the lsim function.