Laminar to Turbulent Transition Over an Airfoil
In this application, AcuSolve is used to solve for the flow field around a high lift airfoil with inflow conditions that lead to transitional flow on the pressure and suction side of the airfoil's surface. The moderate level of turbulence intensity at the inlet, low angle of attack and shape of the airfoil induce a transition to turbulent flow after a separation bubble develops on the surface. The coefficient of pressure is compared against experimental data from laboratory experiments.
Problem Description


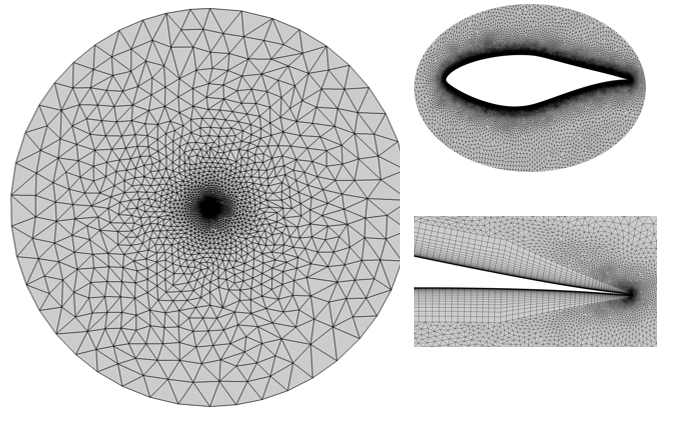
The simulation was performed as a two dimensional problem by constructing a volume mesh that contains a single layer of elements extruded in the cross stream direction, normal to the flow plane and by imposing symmetry boundary conditions on the extruded planes. The airfoil walls are specified as no-slip and the the inlet velocity and eddy viscosity are specified at the farfield boundary.
AcuSolve Results


Summary
The AcuSolve solution compares well with experimental data for transitional flow over the S809 airfoil at a low angle of attack. Additional simulations and measurements for the full drag polar have been tested and compare well with considerably better accuracy when transition closure is included into the RANS solution. The good agreement with experimental results for the transition location and magnitude of expected pressure demonstrate that AcuSolve is capable of predicting the transition onset location for flow over surfaces with mild to moderate pressure gradients.
Simulation Settings for Laminar to Turbulent Transition Over an Airfoil
AcuConsole database file: <your working directory>\airfoil_transition\airfoil_transition.acs
Global
- Problem Description
- Analysis type - Steady State
- Turbulence equation - Spalart Allmaras
- Turbulence transition model- Gamma-ReTheta
- Auto Solution Strategy
- Max time steps - 100
- Convergence tolerance - 0.0001
- Relaxation Factor- 0.5
- Turbulence transition- on
- Material Model
- Air
- Type - Constant
- Density - 1.0 kg/m3
- Viscosity - 5.0e-7 kg/m*sec
Model
- Air
- Volumes
- Fluid
- Element Set
- Material model - Air
- Element Set
- Fluid
- Surfaces
- +z slip
- Simple Boundary Condition
- Type- Slip
- Simple Boundary Condition
- -z slip
- Simple Boundary Condition
- Type- Slip
- Simple Boundary Condition
- farfield
- Simple Boundary Condition
- Type- Far Field
- X velocity = 1.0 *cos(α), where α is the angle of attack in radians
- Y velocity = 1.0 *sin(α), where α is the angle of attack in radians
- Turbulence input type- Auto
- Turbulence intensity type- Value
- Turbulence intensity percent- 0.025
- Simple Boundary Condition
- airfoil surface
- Simple Boundary Condition
- Type- Wall
- Simple Boundary Condition
- +z slip
References
Somers, D., Design and Experimental Results for the S809 Airfoil. NREL/SR-440-6918. 1997