bar3
Creates 3d bars on an axis and returns the handles of the bars.
Syntax
h = bar3(z)
h = bar3(z, color)
h = bar3(hAxes, ...)
Inputs
- z
- Range of the x, y, and z axes..
- color
- string | vector.
- hAxes
- Axis handle. .
Outputs
- h
- Handle of the surface graphics object.
Example
Simple bar3 example:
bar3(rand(5,3));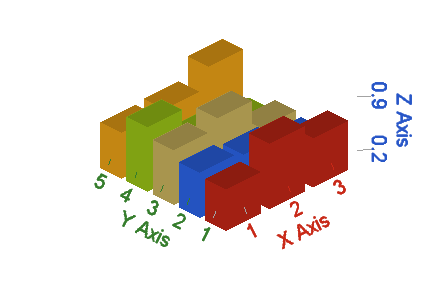
Figure 1. Bar3 plot
Comments
If there is no axis, one will be created. If the first argument of bar3 is an axis handle, bars will be created on that axis.