Visualize Iteration Plots
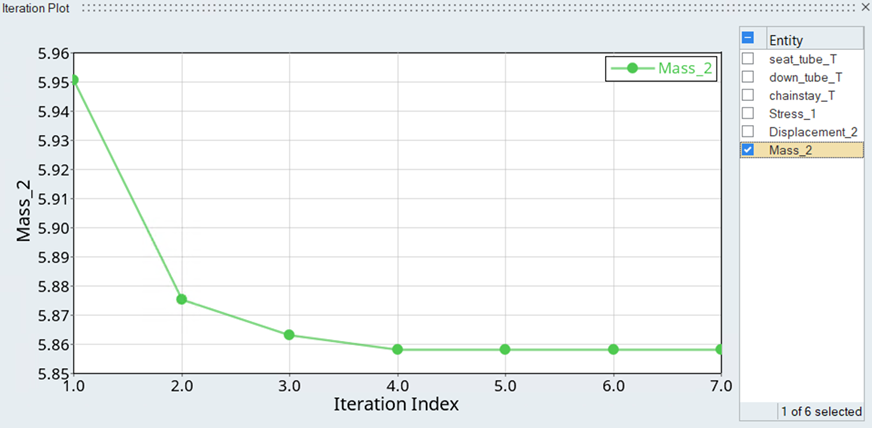
Plot the iteration history of an Optimization exploration's objectives, constraints, input variables and unused output responses in a 2D chart.
View new features for HyperWorks 2020.1.
Learn the basics and discover the workspace.
Discover HyperWorks functionality with interactive tutorials.
Learn how to create, open, import and save models.
Solver interfaces supported in HyperWorks.
A solver interface is made up of a template and a FE-input reader.
Perform automatic checks on CAD models, and identify potential issues with geometry that may slow down the meshing process using the Verification and Comparison tools.
Create, organize, and manage the CAE parts.
Create, edit, and cleanup geometry.
Learn about the different types of mesh you can create in HyperWorks.
Create and edit 0D/1D entities and edit 2D elements.
Create, review, and edit RBE2/RBE3 elements and MPC equations.
HyperMesh composites and tools.
Tools used for crash and safety analysis.
Multi-disciplinary design exploration and optimization tools.
An exploration is a multi-run simulation. Each exploration includes input design variables, and output responses. Explorations may also include goals, consisting of an objective and constraints. Optimization explorations require an objective.
An input design variable is a system parameter that influences the system performance in the chosen output response. Typical design variables may be a part's thickness, shape, or material property. Ranges, with lower and upper bounds, are specified and the variable's value will vary within the exploration. The terms input, input design variable, and design variable are used interchangeably.
An output response is a measurement of system performances, such as mass, volume, displacement, stress, strain, or reaction forces.
Objectives are metrics to be minimized or maximized in an optimization exploration. Minimizing mass to find a lightweight design is a common example.
Constraints need to be satisfied for an optimization to be acceptable. Constraints may also be associated with a DOE. While not used in the evaluation of the DOE, constraints can be useful while visualizing DOE results. Limits on displacement or stress are common examples.
Use the Evaluate tools to run the exploration and review reports.
Export files to the output directory then run the exploration simulations.
Stop a simulation and cancel any runs that are pending or in progress.
Use the Results Explorer tool to review results.
The Results Explorer is an integrated tool which allows users to review and visualize the results of their explorations. The Results Explorer presents different options depending on the type of exploration being reviewed.
Visualize contours and animations for each run in the modeling window.
Once an exploration is complete, review a summary of design variable and output response values in tabular format.
Visualize the relative effects that design variables and output responses have on DOE explorations.
Predict response values resulting from different design variable choices.
Plot exploration inputs and outputs.
Plot a 2D chart of the input variable and output response values for each run in an Optimization exploration.
Plot the iteration history of an Optimization exploration's objectives, constraints, input variables and unused output responses in a 2D chart.
Examples show how to use the design explorer.
Many essential utility tools using HyperWorks-Tcl have been developed over the years to support Aerospace customers. A few tools have been collected and upgraded to be compatible with this release.
Use marine tools to create a stiffener mesh.
Panels contains pre-processing and post-processing tools.
Use the Evaluate tools to run the exploration and review reports.
Multi-disciplinary design exploration and optimization tools.
Use the Results Explorer tool to review results.
Plot the iteration history of an Optimization exploration's objectives, constraints, input variables and unused output responses in a 2D chart.
ON THIS PAGE
Plot the iteration history of an Optimization exploration's objectives, constraints, input variables and unused output responses in a 2D chart.


ON THIS PAGE
(c) 2020. Altair Engineering Inc. All Rights Reserved.