Enter Data Using the Table and Plot Area
Use the table and the plot area together to create, edit, and visualize input points for varying data sets.
The table and plot area are available in tools throughout HyperWorks CFD when defining varying data, such as piecewise linear functions or cubic splines. Any data edited in the either the table or the plot area dynamically updates the other.
-
Add and remove points from the table.
Option Description 
Insert a value before the first data point. 
Insert a value after the selected data point. 
Insert a value after the last data point. 
Delete the selected data point. -
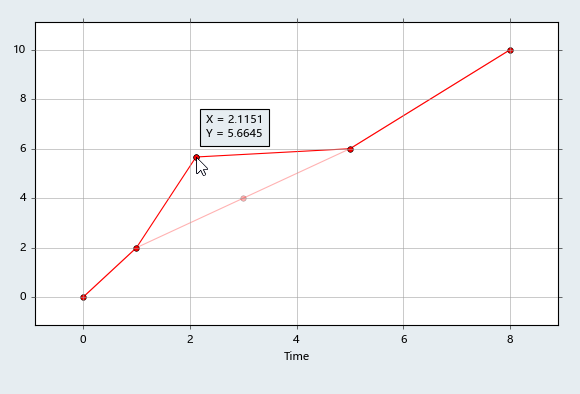
Define the location of the points in the following ways:
- Enter coordinates in the table.
- Click and drag a point in the plot area.Figure 1.
 Use window selection to highlight multiple points then left-click and drag to move all the selected points at once.Figure 2.
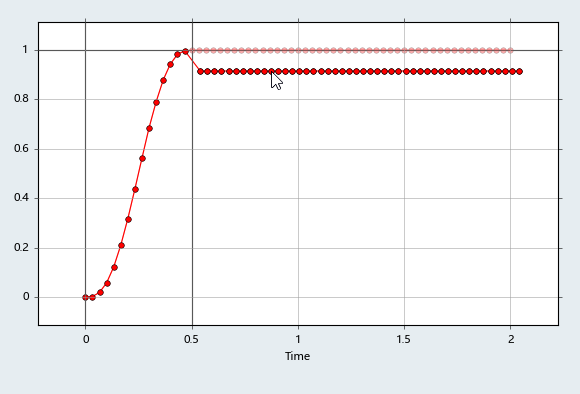
Tip:
- Click
 to import a table data
from a .csv file.
to import a table data
from a .csv file. - Click
 to export table data as
a .csv file.
to export table data as
a .csv file. - Middle mouse scroll to zoom in and out of the plot area.
- Right-click and drag to pan the plot area.