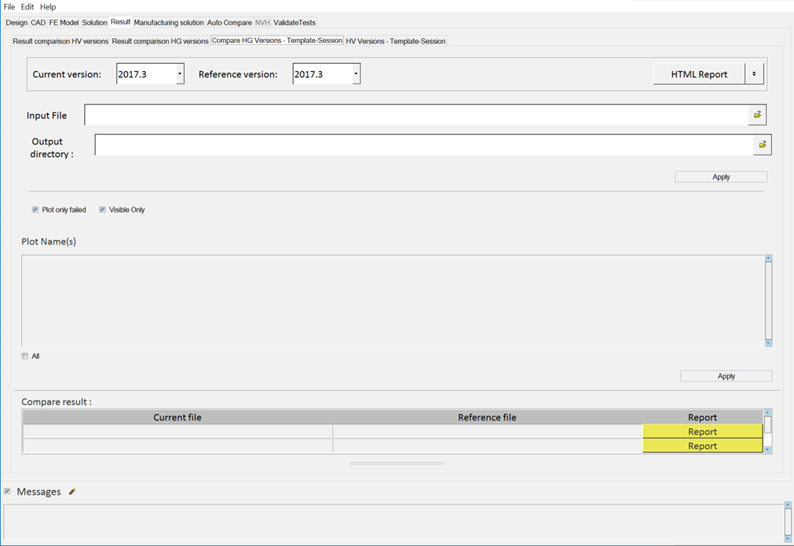
The Compare HG Versions - Template-Session tab performs time history comparison. From
this tab, you can perform the curve super positioning of the current and reference version
result files and plot the difference in curves.
-
Click the Result tab then the Compare HG
Versions - Template-Session tab.
-
Select the current and reference solver
version.
-
Choose between a PowerPoint or
HTML report of the result value comparison.
-
Load the session or template file.
-
Select an output directory.
-
Click Apply to extract information from the data
file.
-
Select plot names extracted from the input file.
Tip:
- Activate Plot only failed to plot only failed
graphs.
- Activate Visible Only to plot only visible
graphs.
-
Click Apply.
The Compare result section displays the current file
and the corresponding reference file. Click Report to
display the diff report detailing the differences between files.
Tip:
- Click Messages to view any
error messages.
- Click Html
Report to generate an HTML report of your
session information for any number of files run through the
process.
