The default option is to rely on the MATPLOTLIB implementation provided by R.
The following script creates the plot (floating figure) shown below.
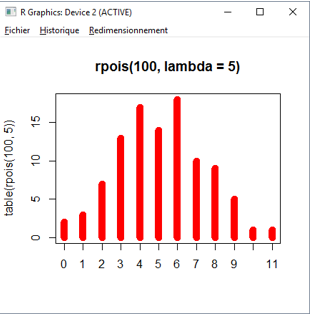
plot(table(rpois(100, 5)), type = "h", col = "red", lwd = 10, main = "rpois(100, lambda = 5)")
Figure 1.
The second option is to leverage the PLOTLY library in R.
For example, the following script creates data and plots it in a new Internet browser
window.
library(plotly)
x <- c(1:100)
random_y <- rnorm(100, mean = 0)
data <- data.frame(x, random_y)
p1 <- plot_ly(data, x = ~x, y = ~random_y, type = 'scatter', mode = 'lines')
pl