The Altair GUI Toolkit is a resource tool for coding Tcl/Tk dialogs. It contains documentation of the HyperWorks commands, demo pages that illustrate our Altair GUI standards, and sample code for creating those examples.
The Model Identification Tool, known as HyperWorks, is a profile in HyperGraph for fitting test data from frequency- and amplitude-dependent bushings to analytical models. The HyperWorks operates in conjunction with HyperGraph, MotionView and MotionSolve to provide you with a comprehensive solution for modeling and analysis.
HgTrans translates solver results files from their native file format to Altair Binary Format (ABF). This can be done using
the HgTrans GUI or via the HgTrans batch mode.
The HyperWorks Automation Toolkit (HWAT) is a collection of functions and widgets that allows an application to quickly assemble
HyperWorks automations with minimal effort and maximum portability.
HyperWorks Verification and Validation Harness (HVVH) is a tool that can be used to verify and validate HyperWorks products. End users can use this tool to quickly evaluate the software quality, performance, reliability,
scalability, and robustness, and to gain more confidence in HyperWorks products.
The Solver version result comparison HG tab performs time history comparisons. From this tab, you can perform the
curve super positioning of the current and reference version result files and plot the differences in curves.
Use the Sensitivity Analysis and Compare Sensitivity Analysis tabs to compare sensitivity data across two versions
of Radioss/OptiStruct. You can maintain a config file that contains the parameter(s) to change for the sensitivity study. Based on the
config file, a certain number of decks are generated and solved, and a report is generated comparing the sensitivity
corridor, response curve (Time vs Response), and statistical details.
Based on the template content, model results are compared for a specific animation/contour set and/or time history/plot
data. User-defined templates include a set of results for comparison and are processed based on this information.
Comparisons can be across all scalar, tensor, and vector results, and for all nodal and elemental results.
The solver output results are used for further design verification and validation. The accuracy of the results as
processed, interpreted, and visualized by a post-processor is key. HyperView is used to post-process most of the solver(s) results. Use the Result tab to ensure that HyperView does not deprecate any result information after post-processing.
Uninstall HyperWorks is a tool to launch the HyperWorks uninstallation program. This program contains two options that allow you to either remove the originally installed
files, or remove all the files that resides in the installation directory.
HyperWorks Verification and Validation Harness (HVVH) is a tool that can be used to verify and validate HyperWorks products. End users can use this tool to quickly evaluate the software quality, performance, reliability,
scalability, and robustness, and to gain more confidence in HyperWorks products.
Use the Sensitivity Analysis and Compare Sensitivity Analysis tabs to compare sensitivity data across two versions
of Radioss/OptiStruct. You can maintain a config file that contains the parameter(s) to change for the sensitivity study. Based on the
config file, a certain number of decks are generated and solved, and a report is generated comparing the sensitivity
corridor, response curve (Time vs Response), and statistical details.
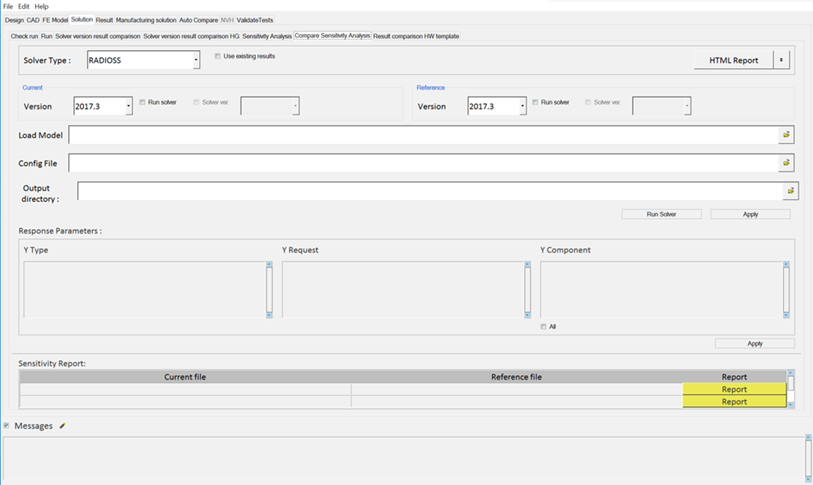
Use the Sensitivity Analysis and Compare Sensitivity Analysis tabs to compare
sensitivity data across two versions of Radioss/OptiStruct. You can maintain a config file that contains the
parameter(s) to change for the sensitivity study. Based on the config file, a certain number
of decks are generated and solved, and a report is generated comparing the sensitivity
corridor, response curve (Time vs Response), and statistical details.
Click the Solution tab then the Compare
Sensitivity Analysis tab.
Select Radioss or
OptiStruct from the
Solver Type drop-down menu.
Choose between a PowerPoint or
HTML report of the result value comparison.
Select the current and reference solver
version.
Tip:
Activating Run Solver is required if the
result files are not available, and the solver needs to be run to
generate result files.
If HyperWorks contains different
versions of solver executables, they will be listed in the Solver
ver. drop-down menu. You can add a different version of an
executable using Edit > Config > Solver executable version.
Note: The HyperWorks
version and solver executable version should be
same.
Load a model file.
Tip: Click Use existing results and select
the current/reference result directory where the results already exist, if
applicable.
Load the config file.
Select an output directory.
Click Run Solver to generate a number of solver decks
based on the seed values in the Config file and start the solver.
Click Apply to extract the TRC information from the data
file.
Select any combination of Y Type, Y Request, and Y Component values from the
populated areas.
Click All to select all items listed.
Click Apply to generate a sensitivity report.
The Sensitivity Report section displays the current file and the
corresponding Reference file. Click Report to display the
sensitivity corridor, response curve (Time Vs Response), and statistical
details.
Tip:
Click Messages to view any
error messages.
Click Html
Report to generate an HTML report of your
session information for any number of files run through the
process.