Properties
The Properties option gives you more control over how the curve names appear in the plot legend.
- Prefix
- Main Curve Name
- Suffix
When a curve is selected from the Plot Browser, the curve name's prefix, suffix, and its legend visibility setting are displayed as properties in the Properties Table, allowing you to define them from there. To apply prefix/suffix settings to more than one curve at the same time, select multiple curves from the Plot Browser and the settings modified in the Properties Table will be applied to all of the selected curves.
A hyphen with a single space on either side (“ – “), is added to the end of the specified prefix and to the beginning of the specified suffix to separate the prefixes and suffixes from the main curve name. For example, if you specify “Run 1” as the prefix for a curve named “Acceleration” and “Lower Torso” as the suffix, the curve name is displayed in the legend as “Run 1 – Acceleration – Lower Torso”.
- Show Label Prefix and Show Label Suffix
- From the Properties Table, activate the checkbox to display the prefix or suffix in the legend. Deactivate the checkbox to hide the prefix or suffix in the legend.
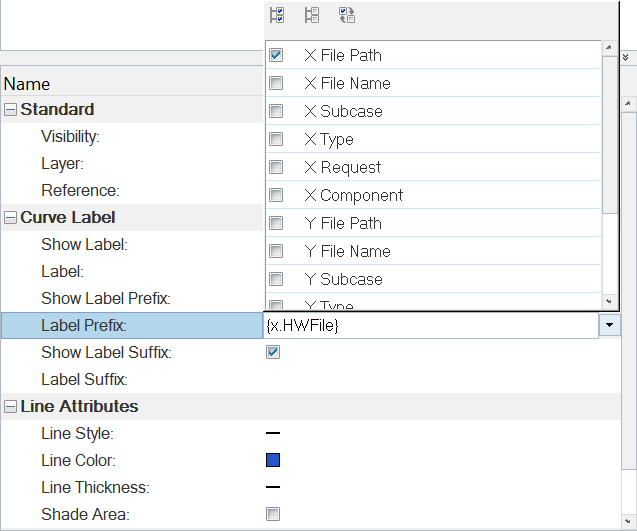
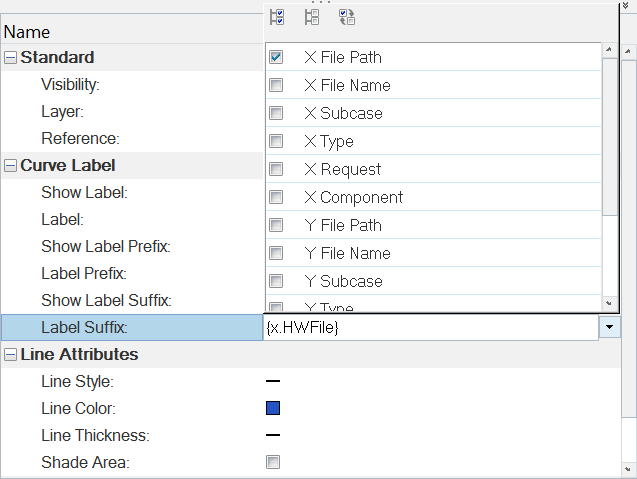
- Label Prefix and Label Suffix drop-down menu
- The images below show the standard options available from the Label Prefix and Label Suffix drop-down menus. You can also enter a string (including Templex expressions) into the drop-down menu as well:

