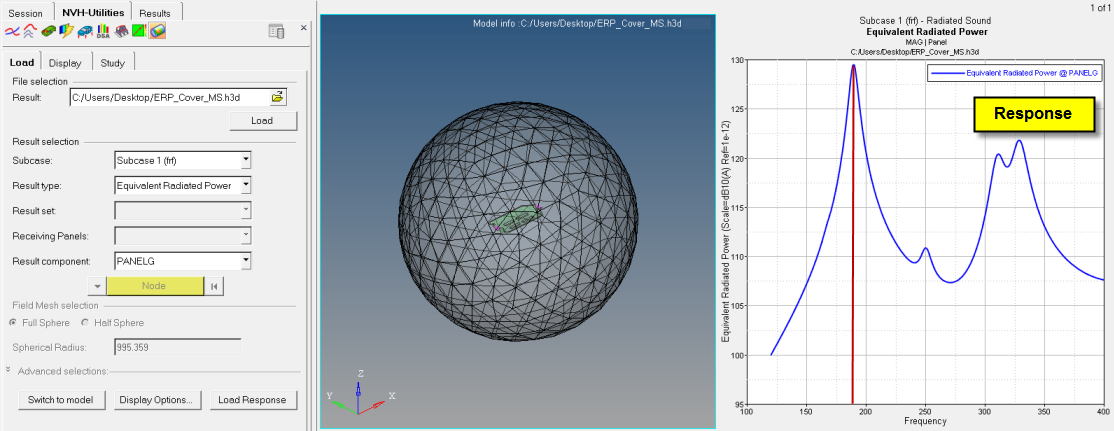
Plot a Response for Radiated Sound
- From the Radiated Sound Load tab, load the result file to view and load the model.
- Make a selection from the Subcase drop-down menu.
- Select a Result type from the drop-down menu: Equivalent Radiated Power, Sound Power, or Sound Pressure.
-
If you select Equivalent Radiated Power:
- From the Result component drop-down menu, select a panel.
-
Click Load Response to plot the response:
- Linear/dB (Magnitude)
- Linear/Octaves (Frequency)
The utility automatically switches to the Display tab.
-
If you select Sound Power for the result type:
- For Result set, select Source Side or Receiver Side.
-
Click Load Response to plot the response.
The utility automatically switches to the Display tab.
-
If you select Sound Pressure for the result type:
- For Result set, select Sound Pressure or Power from Pressure.
- For Receiving Panels, select a set that corresponds to particular source nodes. This can be used for panel participation.
-
For Result component, select the microphone location:
- Select a node from list
- Select the microphone location from model
-
Click Load Response to plot the response.
The utility automatically switches to the Display tab.
Figure 1.