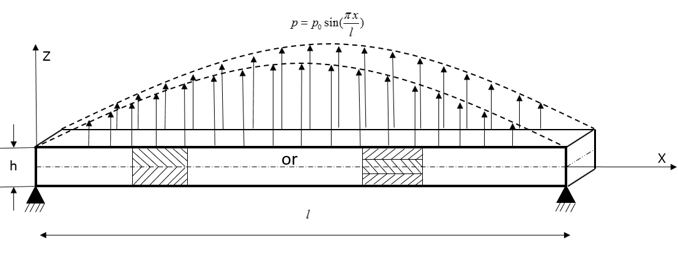
This problem discusses about the composite shells two- or three-layer plate subjected
to a sinusoidal distributed load, as described by Pagano (1969).
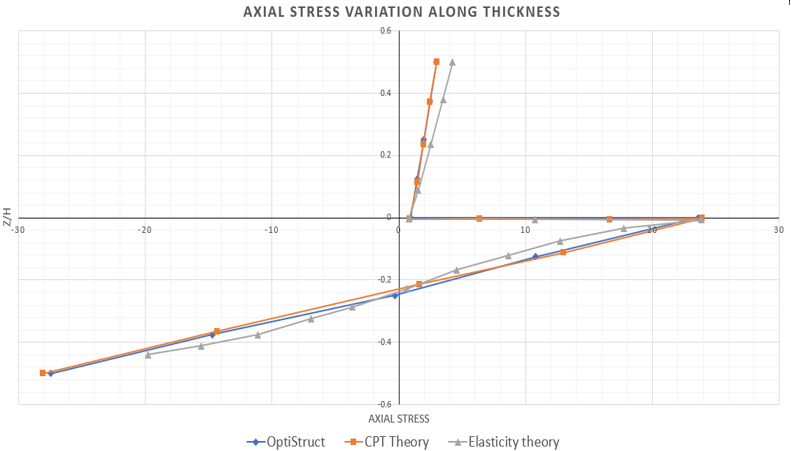
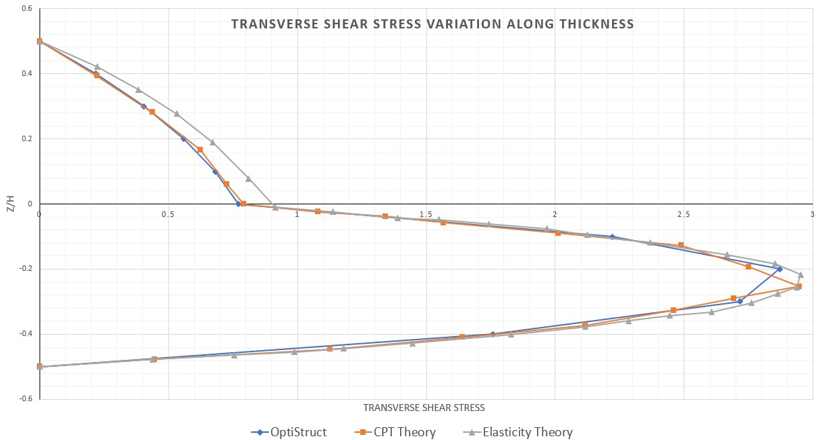
The resulting transverse shear and axial stresses through the thickness of the plate
are compared to analytical solutions using classical laminated plate theory (CPT)
and linear elasticity theory.
Benchmark Model
Figure 1. Composite Shell Subjected to Uniformly Varying Sine
Load
Two models have been considered - composite plate with two and three-ply layers.
For the two-layer model, top layer is in 90° and bottom layer is in 0°.
For the three-layer model, the top and bottom layer are in 0° orientation
and the middle ply is in 90° orientation.
The material properties are:
EL
25*106 lb/in2 (172.4 GPa)
ET
1.0*106 lb/in2 (6.90 GPa)
GLT
0.5*106 lb/in2 (3.45 GPa)
GTT
0.2*106 lb/in2 (0.2 GPa)
VLT = VTT
0.25
Where,
L
Signifies the direction parallel to the fibers
T
Signifies the transverse direction
Limit stresses and limit strains used are:
Stress Value
Xt
Xc
Yt
Yc
S
GPa
2.07*10-4
-8.28*10-5
3.45*10-6
-1.03*10-5
6.89*10-6
lb/in2
30.0
-12.0
0.5
-1.5
1.0
Results
For plate with S=4:
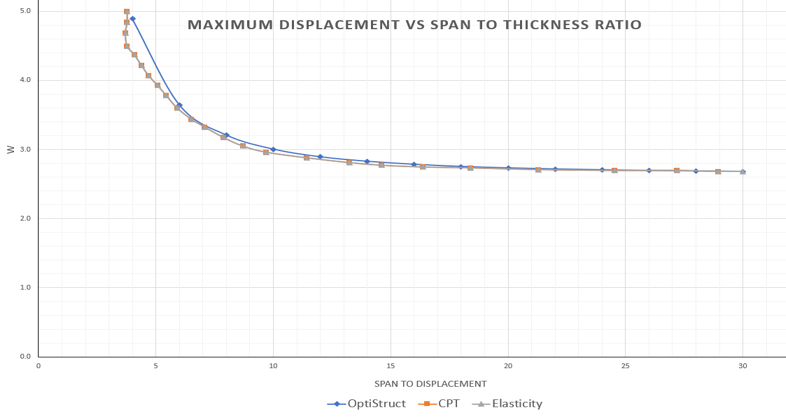
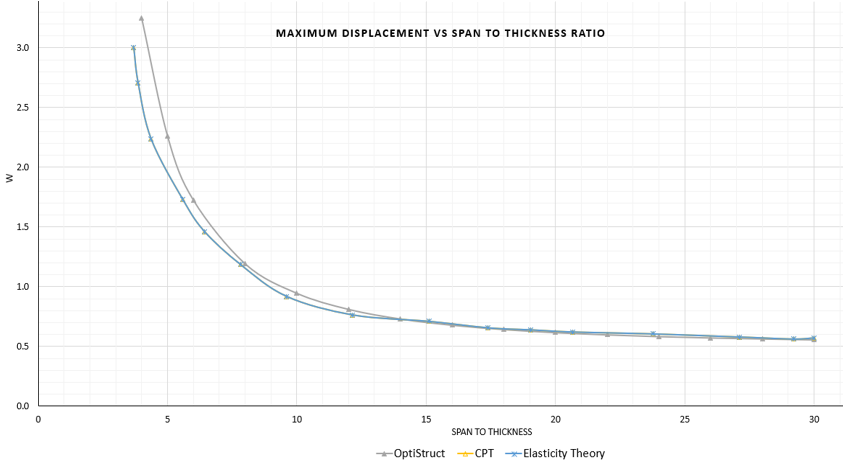
Figure 2. Maximum Displacement vs Span to Thickness Ratio of
Two-layer 2nd Order Plate
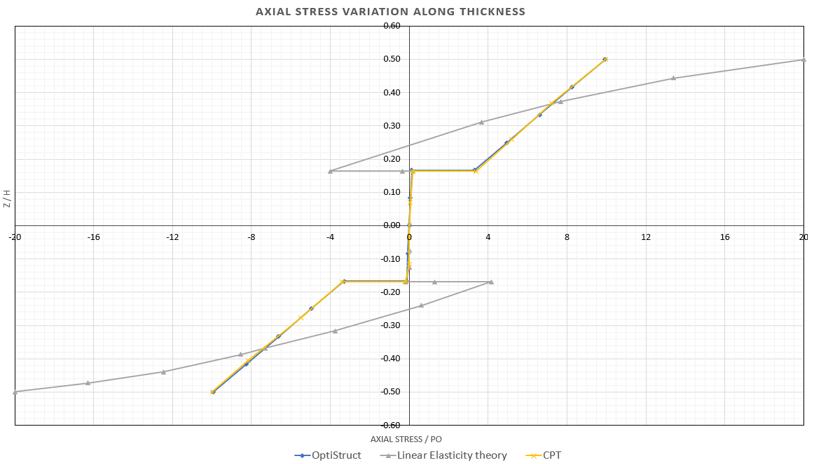
Figure 3. Axial Stress Distribution through the Thickness of
Two-layer 2nd Order Plate
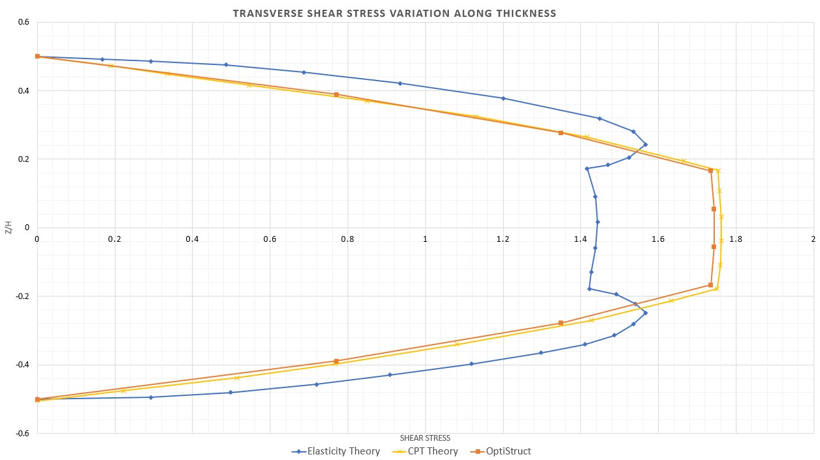
Figure 4. Transverse Shear Stress Distribution through the
Thickness of Two-layer 2nd Order Plate
Figure 5. Maximum Displacement vs Span to Thickness Ratio of
Three-layer 1st Order Plate
Figure 6. Axial Stress Distribution through the Thickness of
Three-layer 1st Order Plate
Figure 7. Transverse Shear Stress Distribution through the
Thickness of Three-layer 1st Order Plate